Sound Analyzer Basic: Your Mobile Real-Time Audio Analysis Tool
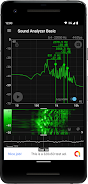
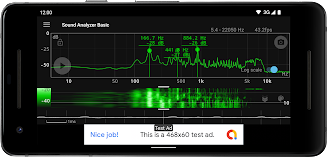
Sound Analyzer Basic is a mobile application designed for real-time analysis of audio signals. It simultaneously displays frequency (Hz) and amplitude (dB) spectra, along with a dynamic waterfall view showing spectral changes over time, and a clear waveform visualization. The app boasts high frequency measurement accuracy, typically within 0.1Hz error in low-noise conditions.
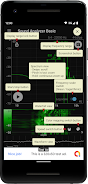
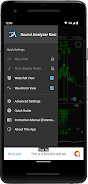
Key features include a peak frequency indicator, intuitive touch controls for adjusting display ranges, selectable linear or logarithmic frequency axis scales, a detailed waterfall view, a waveform display, and a convenient screenshot function. While the app supports a high frequency range setting up to 96kHz, frequencies above 22.05kHz might be attenuated by device limitations, potentially resulting in some background noise. Note that certain frequencies, such as 48kHz and 96kHz, may exhibit increased noise on some devices due to inherent filter processing.
Here are six key benefits of using Sound Analyzer Basic:
-
Real-time Spectral Analysis: Instantly view frequency (Hz) and amplitude (dB) spectra for immediate audio signal interpretation.
-
Dynamic Spectral Tracking: Monitor the evolution of audio signals over time with the visual waterfall display.
-
Comprehensive Waveform Display: Gain a complete understanding of your audio signal with simultaneous waveform visualization.
-
High-Precision Frequency Measurement: Benefit from highly accurate frequency measurements, with errors generally under 0.1Hz in optimal conditions.
-
Customizable Display: Easily adjust display ranges via touch controls to focus on specific frequency bands.
-
Flexible Frequency Axis: Choose between linear and logarithmic frequency axis scales for tailored data interpretation.